SciFig

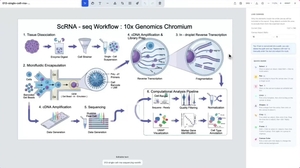
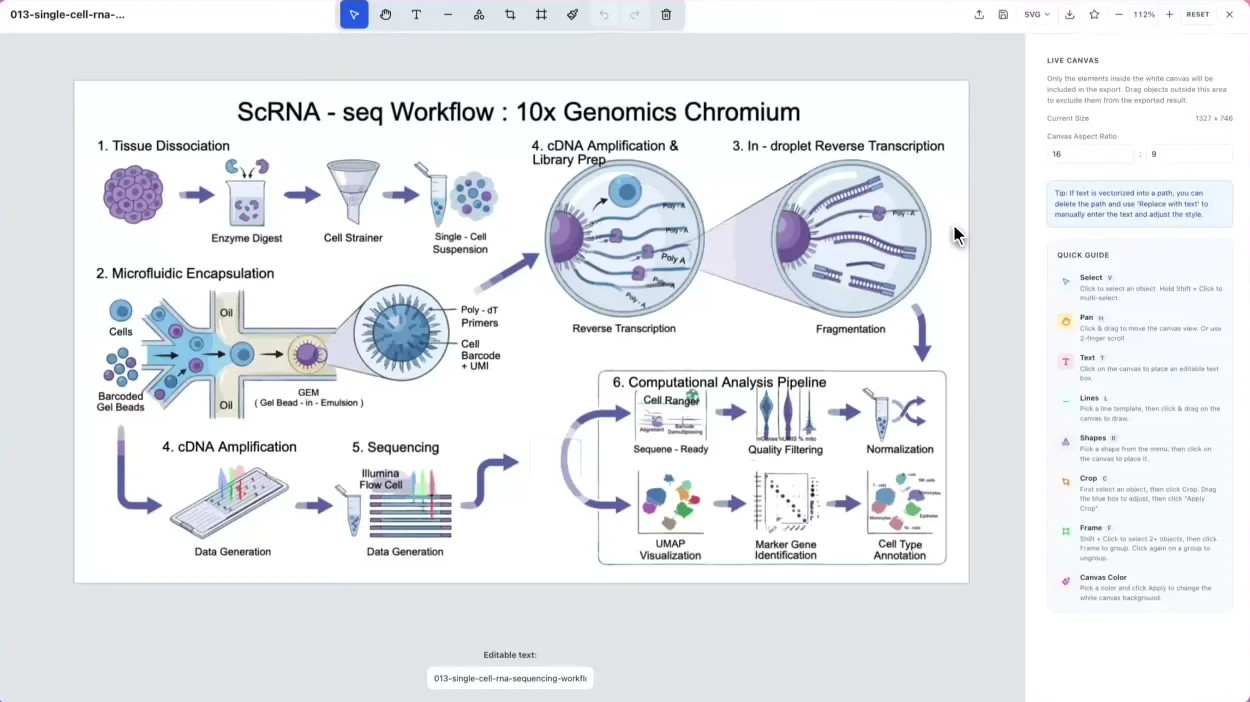
SciFig helps researchers explain ideas with scientific illustrations, charts from table data and editable SVG flow diagrams. Illustration creates visual drafts from prompts, sketches, reference images, PDFs and lab photos. DataChart plots real uploaded tables, while FlowChart supports workflows and model architectures with editable text, nodes and connections. The three workspaces serve research papers, posters, teaching and presentations. Editing and export options vary by workspace; review scientific details and statistical choices before using the results.